Tables. In Excel? Surely that’s a bit redundant? That’s what I thought for years, until I starting trying to optimise a major spreadsheet and thought I’d give them a go.
Tables are almost like a different brand of spreadsheet. They have their own syntax and rules, and don’t behave the same as Excel at all. This can be very off-putting – after all, who would want to have to learn a whole new way of working to do the same task as Excel can already do? The answer is – you would!
First off – what is a Table in Excel? A Table is a whole object of data which works as a whole. Normally in Excel each cell is sort of independent, and relates itself to others through formulae that you write. In a Table a column acts together, updating formulae throughout the whole column if any of the cells changes, and allowing you to reference a column, a row, the header, all the whole set of data.
You can have multiple Tables on a worksheet, each of which has its own reference and they can work independently of each other. It actually makes sense in most cases to work on one worksheet with multiple Tables, instead of spreading data across multiple worksheets.
When you write below the last row in a Table it will automatically extend to cover the new row, applying formatting and formulae automatically, and enveloping the new row in any references to the Table.
Tables are designed to be used with each row being one record of the same type. In this way they are similar to a database, and actually the referencing can be similar to referencing database fields.
So, how do you start using these Tables? Simple – you can use Insert -> Table and choose the cells that you want to use, whether already containing data or blank cells which you are planning.
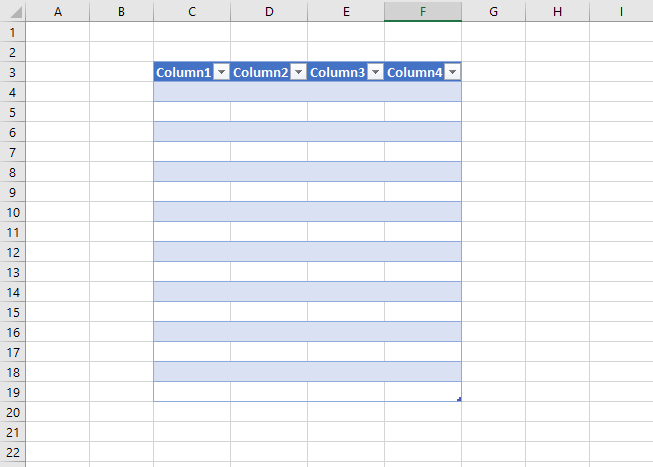
Your Table looks different to the standard Excel cells. You can change the autoformat of the table in the Table Tools Design tab, and these formats will continue when you expand the Table too. Click and drag on the little corner tab at the bottom right and you can add as many rows and columns as you like. The top row is your header row, and each column header must be unique – this is where it gets like database design, as the column headers are the identifiers for the columns. You can give them meaningful names, or just leave as Column1 etc.. You can also rename the Table itself by clicking on the Table and changing the Table Name in the Design tab (top left below).

I’ve named my Table Car and the columns are now characteristics of cars. I can add data to the Table now.

Every time you get to the end of the row and hit TAB, or move your cursor under the Table and start typing, it adds another row automatically. This is great for the formatting, but is it so much better than vanilla Excel yet? Let’s take a look at formulae. First of all, let’s add two more columns to the Table. Drag the bottom-right corner two columns to the right. Name the columns Cost and Total Cost.

In the Total Cost column we will add a formula. Just write this in the cell below the column header.
=[Number]*[Cost]Hmm. That’s a lot easier than working out the cell references? Is it always that easy to read? Yes – Excel Tables have made it much easier to write and read formulae. You can reference these from other Tables, or from standard Excel cells. There are a few places where you can’t reference like this – conditional formatting and named ranges are two that come to mind, although there are shortcuts.
Your Table will now have the formula all the way down the column. Write some values in for cost, and it will work out the total cost of all the cars in the country.
If you are referencing multiple Tables, or from outside of this one, you need to tell Excel which Table you are using. Prefix the identifier with the Table name – Car.
=Car[Number] * Car[Cost]